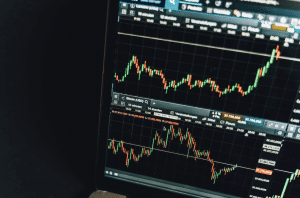
Traders employ technical indicators to anticipate subsequent market movements based on previously established patterns. They are applied to charts and graphs in the hopes that they will reveal developing market patterns that will aid traders in making informed decisions about when to enter and exit transactions.
Even though there are a wide variety of technical indicators available, we will be focusing on those that are most useful when trading binary options. However, if you are looking for more information, you can get it from BinaryOptions.com, which provides the best educational resources. Without further ado, here are some of the most common indicators for binary options that may be applied to various securities:

1. Moving Averages
The moving average of security prices is a very useful indicator, both on its own and in combination with other, more technical indicators. This type of average basically smooths out the price average by getting rid of noise that isn’t always important for seeing larger patterns and shifts.
Even though moving averages are part of other indicators, traders can look at them on their own to learn useful things. If the moving average stays flat for a long time, even if the price is fluctuating, this is usually not a sign of a trend but rather a range market. Conversely, if the slope is steeply ascending, prices are expected to rise.
The use of moving averages can be somewhat constrained by the fact that they do not reveal the true value of a security’s price to traders of binary options. Yet another advantage of moving averages is that they may be customized to cover any time frame.
2. Awesome Oscillator
The Awesome Oscillator (AO) is another invention of Bill Williams. It is a type of oscillating indicator that does not have any limits and is used to gauge the relative value of a security or asset.
Using this indicator, binary options traders can better pinpoint the underlying asset on which to base their trades. This metric simply compared the current rate of progress against the overall rate of progress. Traditional momentum indicators tend to be wrong, so this one changes the data to get rid of that problem.
One of the most popular free binary options indicators, this may be found across a variety of trading websites and platforms. In its oscillator form, its values swing above and below a zero mean. Oscillating indicators based on histograms follow similar rules. That is to say, an AO reading above zero denotes an increasing trend, while a reading below zero denotes a negative trend.
3. Moving Average Convergence Divergence
The Moving Average Convergence Divergence (MACD) Divergence is a popular oscillating indicator for binary options traders since it takes price momentum and market movements into account.
Using a band and a zero line in the center, MACD tracks the performance of an investment. Above this signal line, the MACD band jiggles around. A rising trend in the underlying security can be inferred if the MACD band remains above zero for a lengthy period of time. On the other hand, a prolonged period of time spent with the band below zero indicates a declining tendency for the underlying security.
Most of the time, the MACD bands above zero indicate a time to enter a trade. Even while MACD is most commonly used for trading, it may also be utilized for betting on binary options, with the crosses typically signaling buy and sell.
4. Parabolic SAR
Parabolic SAR is a technical indicator in finance that shows not only the current price trend but also when the trend may reverse.
Dots are plotted on a chart, either above or below the price bars, to represent the indicator. The price changes depicted by these dots are merely indicators. If the dot is above the price bar, a bullish trend is developing. A bullish trend is shown when the dot is located below the price bar. When it turns, though, it suggests that prices may soon alter course.
This is an example of a binary options indicator that can be used to predict whether an up or down trade will be profitable.
While it is a useful indication, the Parabolic SAR does have certain limitations. When prices are flat, it may give off misleading signals. For traders of binary options, the stakes are raised under certain conditions. This indicator is most effective when combined with oscillating indicators like the stochastic oscillator or the relative strength index (RSI) for a more complete signal.
5. Momentum
In finance, momentum is the rate of change in securities prices. Simply put, it measures the rate of price change over a specified period of time.
Momentum is a tool that traders use to figure out when the best time is to make a trade, which is usually when prices are going up. Because of the temporal constraints inherent in binary options, this is especially pertinent to these contracts.
Several other technical indicators that analyze price movement speed use momentum as a key metric in their calculations. Momentum is determined by an oscillator.
Momentum trading is characterized by entering the trade as prices are rapidly rising and exiting at their highest point. Whether you are trading stocks, currencies, or even binary options, this is a valuable tool.

Conclusion
Instead of relying just on one indicator when trading binary options, think of indicators as part of a holistic strategy. The stocks that each individual investor prefers to hold onto vary from person to person. Put them through their paces on a test platform before committing to one.


